The profit and loss statement (or P&L in accounting jargon) is arguably the central management statement for most SMEs, recording the majority of operational activities over any period of time, usually monthly. Ranging from the total revenue received to all the expenses incurred by the business over the period, the P&L is a treasure trove of information for any business owner.
This article aims to provide a detailed explanation of the role of the P&L, what information it contains, how to use it to determine an array of essential business health indicators, as well as how to set up a simple, well-tailored P&L structure for your own business.
BASIC FORMAT OF THE P&L
Modern cloud-based accounting platforms allow for sleek and elegant layouts of the P&L. Modern platforms also mean that it can be built in a highly customisable way, tailored to the specific needs of the business owner. The five main sections of the P&L are shown below. This is the most essential, bare-bones P&L format and really tells us only two things: How much money came in, and how much money went out.
The P&L’s skeleton is shown below:
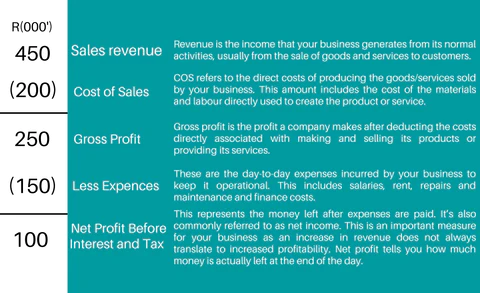
Now that the skeleton is in place, we can start to flesh things out a bit.
We can add different revenue accounts for various income streams, or set up tracking categories – but more on this later. We can also create cost of sales accounts that show the direct expenses incurred to generate specific revenue items, as well as the other general expenses and overheads (OPEX) which the business has incurred over any given period of time, ranging from rent and salaries to staff welfare and entertainment.
GUIDING PRINCIPLES
Someone once said, “It ain’t simple being cool, but it’s cool being simple”, so keep it simple and avoid an overcrowded statement. Analyse your business’s revenue streams and major expenses and design your P&L layout accordingly. Keep the focus on the most important thing.
For revenue, ensure that you have a streamlined process for your invoicing and payment platforms. Cloud-based accounting tools are brilliant at setting up connections and integrations (called APIs) with other cloud-based tools and applications. It’s like one big ecosystem of chattering computer applications floating around in the cloud. Setting up your revenue and invoicing processes to be automated as far as possible is a great help towards the overall integrity of your business data. It also saves an incredible amount of time!
The same applies when capturing expenses through platforms like Receipt Bank – a simple system can go a long way in ensuring the accuracy and completeness of your P&L’s expense information. Clean revenue and clean expenses. Fantastic!
ANALYSING THE P&L: FROM DATA TO INFORMATION TO KNOWLEDGE
The management gurus are forever telling us to “measure what matters”. This applies to the P&L too. You can use the data from the P&L to identify key performance indicators rather than a myriad of confusing technical data. Determine what is really important and do not settle for standardised, generic reports.
The true value of the P&L is realised when relevant information is identified from within the report, turned into knowledge and used to the business’s advantage. Based on the industry, age, size and goals of the company, various key ratios can be determined. Using the correct software to prepare your statements will also simplify these ratios. Ratios can be presented and interpreted easily by converting them into colourful graphs and diagrams.
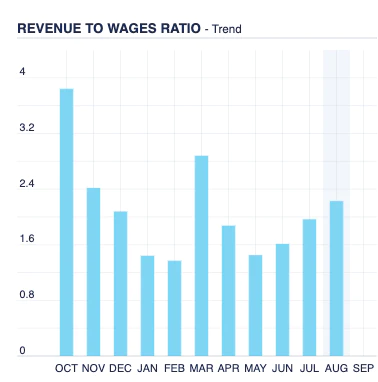
As an example, in service-based industries, salaries generally make up the largest portion of monthly expenses. From the profit and loss statement a revenue-to-salaries ratio can be determined. This provides business owners with valuable insight into their ability to pay salaries when revenue decreases.
An example of a revenue-to-salaries (in this case, revenue-to-wages) ratio is shown below:
A few basic questions to ask ourselves could be:
- How is revenue growing?
- What is the general gross profit % of the business?
- What portion of monthly revenue goes to covering overheads and other expenses?
- What are the main monthly overheads?
- What is our “baseline” overhead expenditure on a monthly basis?
- What does the bottom-line (the net profit) look like, month-on-month?
- Where can we eliminate unnecessary costs?
The 80/20 rule (also called the Pareto Principle) can be easily applied and often delivers fantastic insights to hidden or obscured information. It is a surprising universal law that works well in the context of the P&L. Using the Pareto Principle, ask yourself some of these questions when looking at the P&L of your business:
- Which clients are responsible for 80% of revenue?
- Which products/services are responsible for 80% of revenue?
- Which expense line items account for 80% of the monthly cash outflow?
- Which marketing tools bring in 80% of the revenue-generating leads?
This is by no means an exhaustive list, but it should get you thinking in terms of this mysterious universal law. Try it, you might be amazed at the insights that can be gleaned from this simple approach.
XERO’S ADDITIONAL USEFUL FEATURES
As mentioned previously, the P&L consists of two main components: revenue and expenses.
Our revenue’s data integrity will come down to how well the invoicing function is run in Xero. Set up “Item Codes” for each product or service to ensure that invoicing is quick and easy, containing all the necessary information relevant to the product or service being sold.
Tracking Categories can also be created to assign both revenue and expenses to certain products, projects or services for “per product” reporting. Tracking Categories is a powerful tool to segregate different segments/departments/products/services and so on within the business to gain visibility on them in isolation. Reach out to us if you need help setting this up.
Once again, you don’t want to create administrative burdens by incorporating excessive detail which will result in you drowning in the complexity of your own design. Keep it as simple as you can.
FINAL THOUGHTS
A picture is worth a thousand words, and if that is the case, the P&L is worth ten thousand. It speaks volumes about your business. A customised report tailored to your specific business model is an invaluable source of information for timely and informed decision-making.
P&L’s of the 20th century contained all manner of boring and generic “accounting-speak”. Luckily for us, in the 21st century, there is a lot more freedom in how businesses are defined.
The P&L is undoubtedly an essential statement for any business owner to read and understand at a glance. Let’s make the once-off investment of setting it up beautifully at the outset to reap the benefits in the long term. The P&L has profound insights to offer on your business if it is designed well. The name of the game is management through conscious business design, and the modern marketplace demands it.
Speak to our helpful consultants , they are available for your reporting and business processing needs.
👉 READ: Part 3 – An Explanation of the balance sheet for business owners